

Build your own report in Explore
Group any list, choose columns and export.
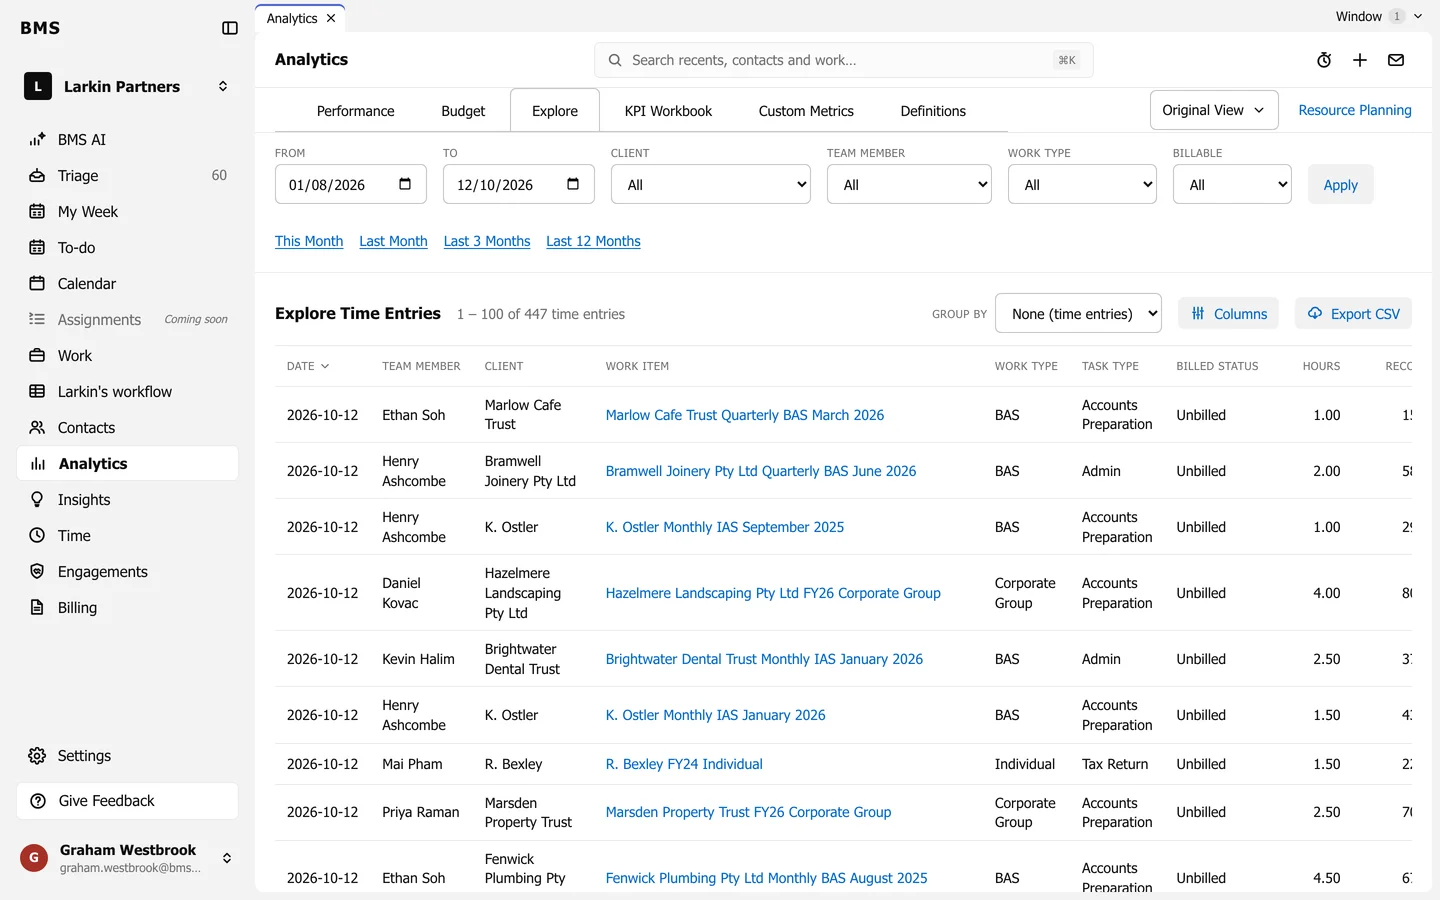
Analytics > Explore lists every time entry behind the figures, and lets you build a report from them.
-
Set the dates and filters at the top and press Apply.
-
Choose Group by, such as client, team member or work type, to total the entries.
-
Press Columns to choose which figures show, including your own custom metrics.
-
Press Export CSV to download it.
Save it as a view from Original View to open it again, or pin it to your dashboard.