

Analytics: Performance
Revenue and operations tiles, hours and production by month.
Analytics in the sidebar opens Performance.
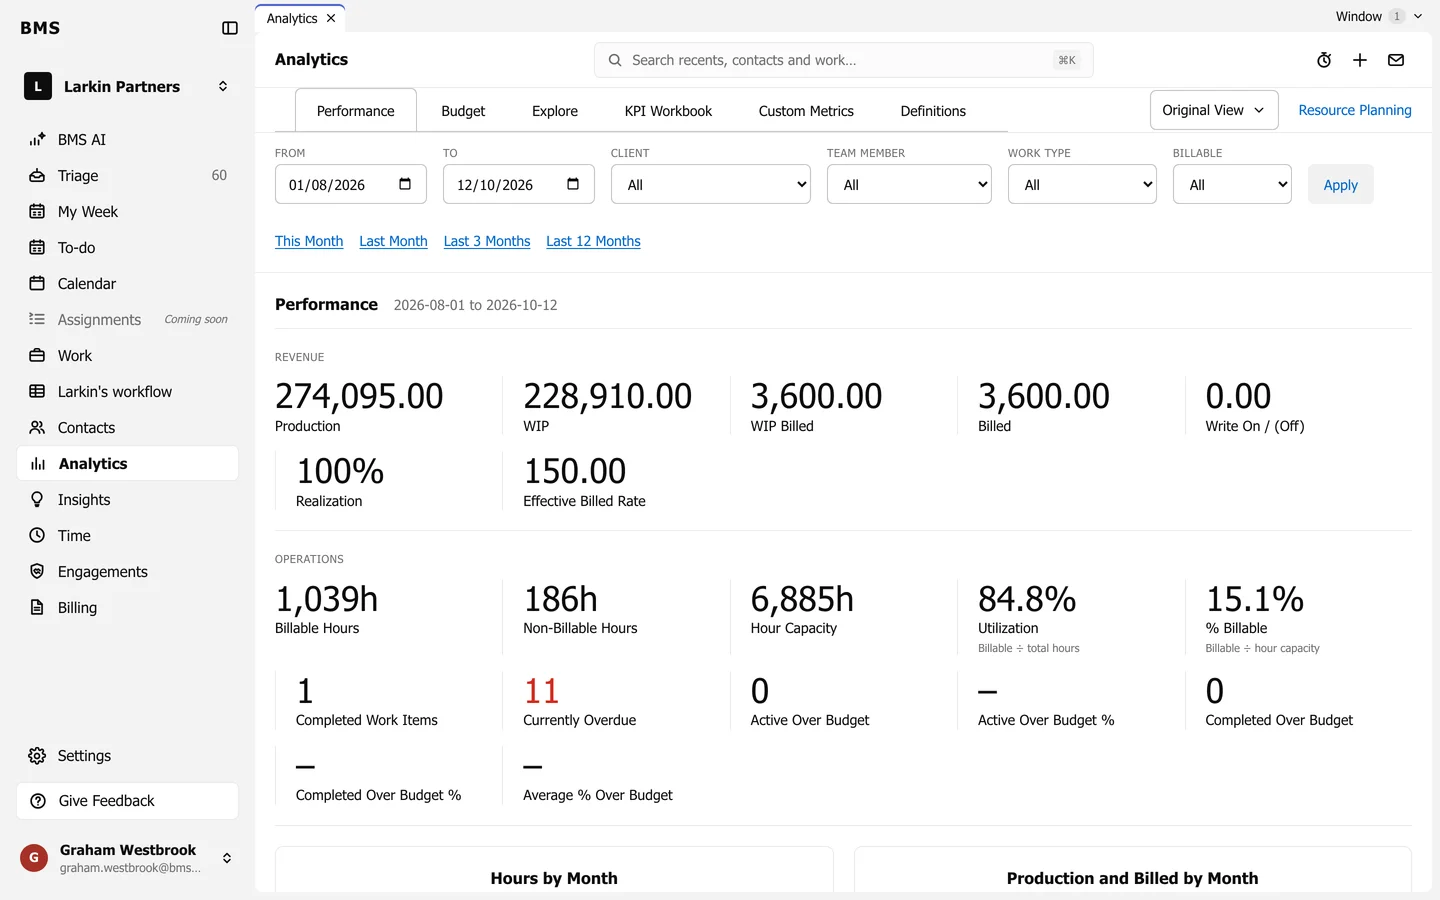
- Set From and To, or press This Month, Last Month, Last 3 Months or Last 12 Months.
- Narrow by Client, Team Member, Work Type or Billable, and press Apply.
Revenue shows Production, WIP, WIP Billed, Billed, Write On / (Off), Realization and Effective Billed Rate. Operations shows billable and non-billable hours, hour capacity, Utilization, % Billable, completed and overdue work, and work over budget. Charts of Hours by Month and Production and Billed by Month follow.
Original View saves and reopens your own views; Definitions explains every figure.